Visualization
New Annotation Plots
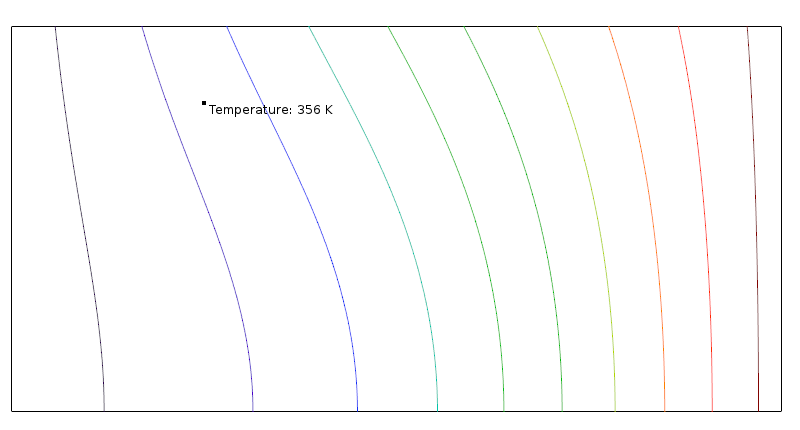
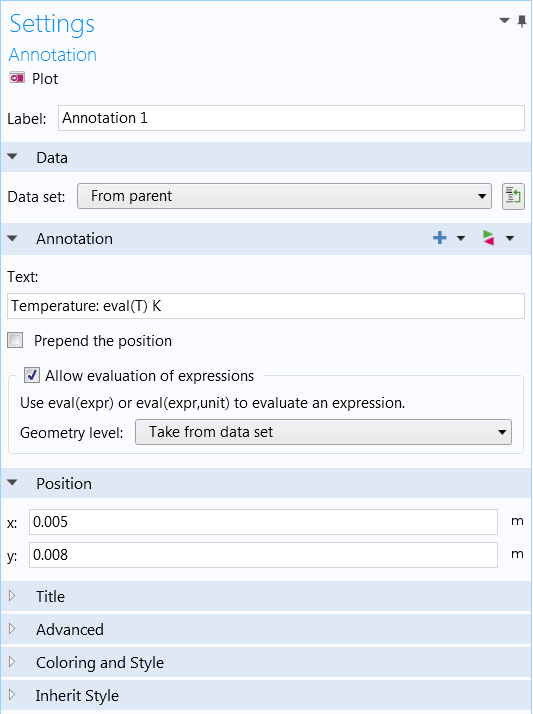
Annotation plots, new with COMSOL Multiphysics version 5.2, can be used for displaying customized text in 2D and 3D plots. This functionality is found under More Plots in the Add Plot section of the ribbon. Simply define the location and text for the annotation. The text can include the results from evaluating expressions by typing in eval(expr). The software will automatically grab the value and insert it into the text.
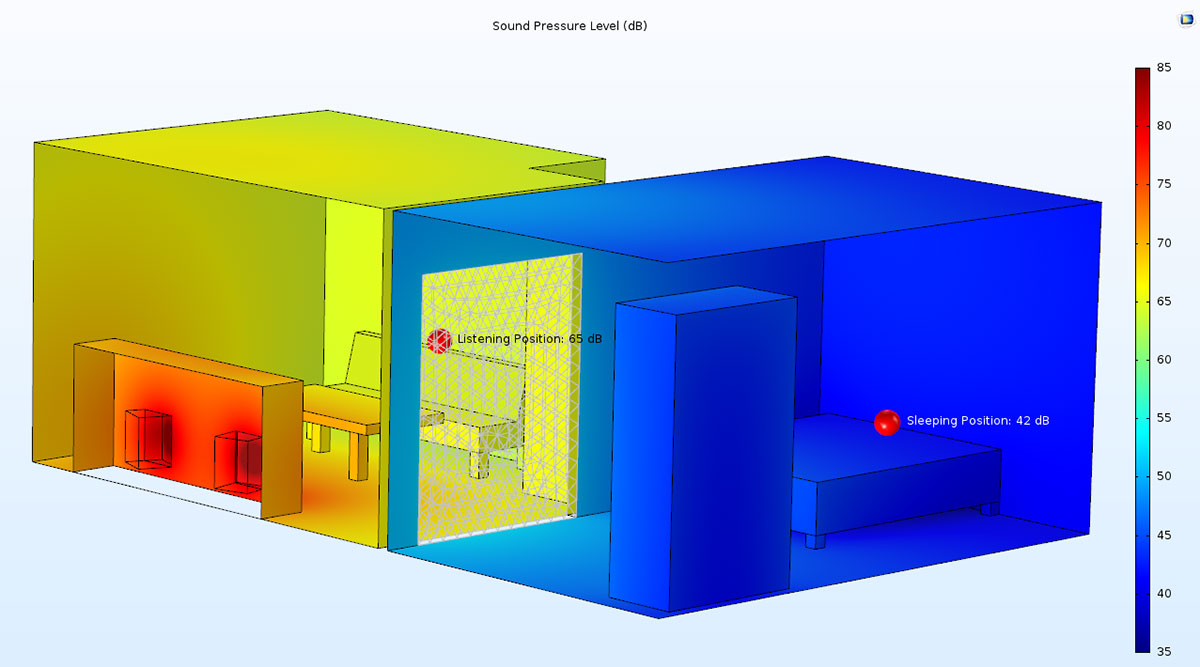 Annotations used in a room acoustics model to label the positions of two occupants of a house.
New Smith Plot Group
COMSOL Multiphysics version 5.2 contains a new Smith plot group, where you can plot impedance, admittance, and reflection data in a Smith grid. Smith plots are useful for relating complex valued S-parameters (reflection coefficients) to input impedance, or to admittance of antennas, transmission lines, and other network components.
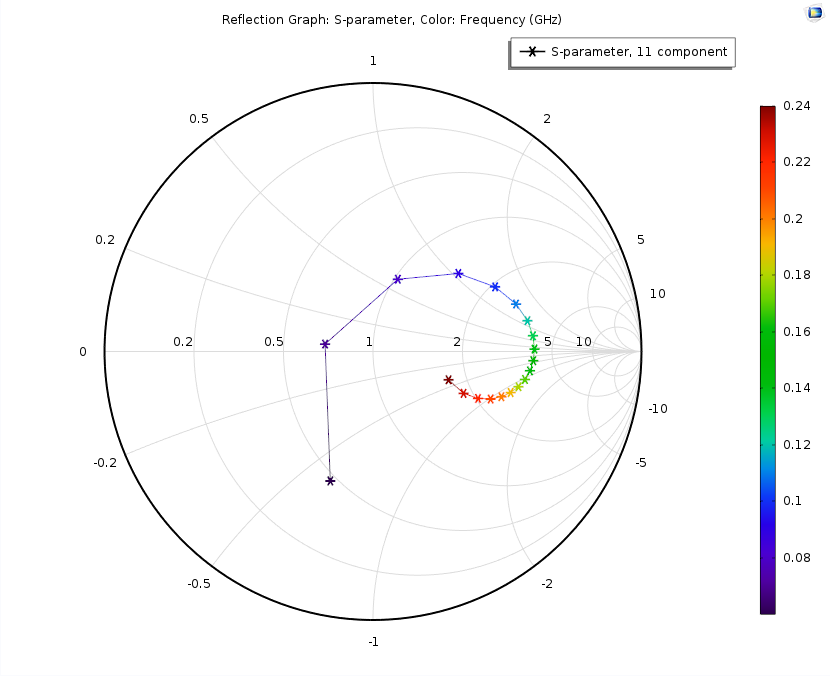 A Smith plot in the Biconical Frame Antenna application, showing an S-parameter in a Smith grid.
New Octave Band Plot Feature
Measurement tools showing both a sound pressure level response and material data, such as absorption coefficients, are often displayed in frequency bands as well as in a weighted dB scale. The new octave band plot is used for representing simulation results in the same manner. The plot uses octave bands or 1/3-octave bands to show the decibel scale over the specified frequency range.
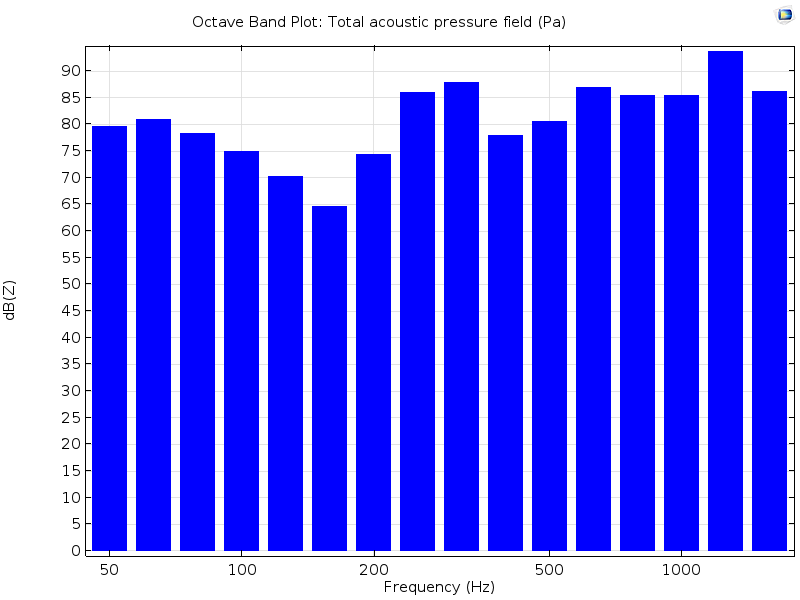 An octave band plot in the Absorptive Muffler application, using 1/3-octave bands to show the total acoustic pressure field.